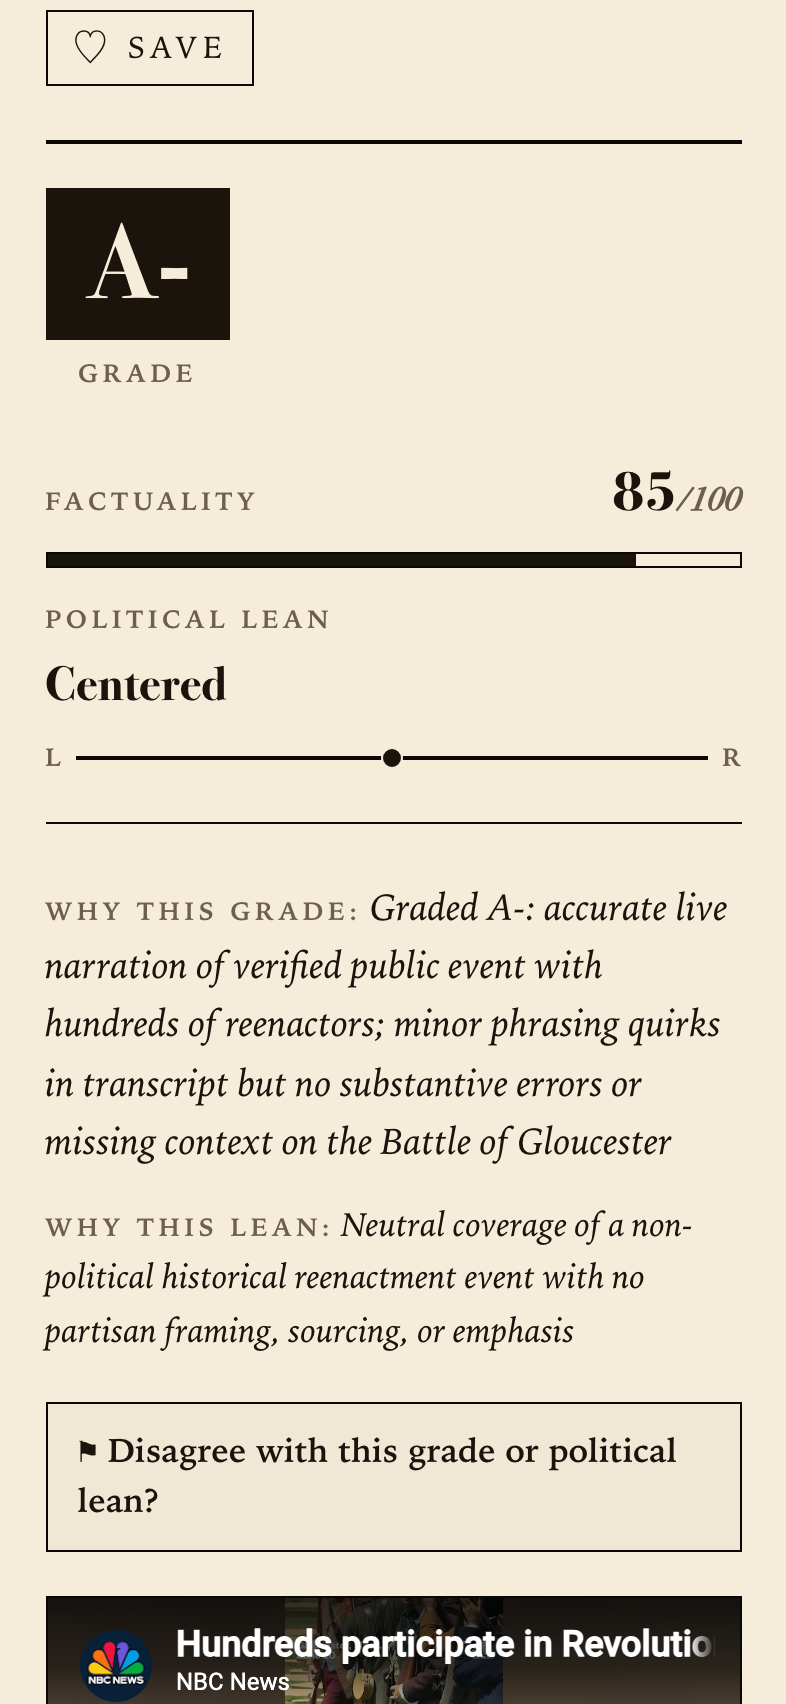
House Speech Highlights Medicare, Debt, Demographic Pressures
🔒 The letter grade, factuality score, and political-lean rating for this report are part of CladFacts Premium. The full report below is free to read.
Topics in This Edition
Summary
C-SPAN clip captures a House floor speech, likely by Rep. David Schweikert, using charts to discuss federal spending, Medicare growth from ~$1T to $2T, per-enrollee costs rising to $34k, and debt per capita. The speaker highlights 6.9% fraud estimates, baby boomer demographics driving utilization, and SS trust fund exhaustion leading to benefit cuts. A child (his 4-year-old son) is visible in the background, matching the video title. The address draws on CBO projections, Trustees reports, and historical data to argue policy design creates exploitable incentives; it calls for tech-driven cures, nutrition reforms, and productivity gains over rationing. Sourcing relies on government data and charts displayed on the floor.
Editorial Assessment
Claims largely track official 2026 projections from SSA Trustees (OASI depletion Q4 2032, ~78% payable) and CMS enrollment figures (~67-70M Medicare beneficiaries). Debt trajectory and per-capita increases since 2011 are directionally accurate per Treasury/CBO trends. Presentation omits recent policy changes or revenue-side options and attributes most growth to demographics and design rather than other drivers. The viral kid element adds human interest but does not alter the policy substance. Viewers receive a data-heavy warning on entitlements but limited discussion of offsetting factors like economic growth or prior reforms.
Key Moments
Medicare spending will double from $1T to $2T per year in six years
Aligns with CMS/KFF and CBO 2026 projections for Medicare outlays growth.
Social Security OASI trust fund depletes in a little over six years, triggering 22-24% benefit cut
Matches 2026 SSA Trustees Report: depletion Q4 2032 with ~78% benefits payable.
Government fraud/underpayments estimated at 6.9% or under 7% of spending
Improper payment rates cited in various GAO/HHS reports hover near that range for certain programs; aggregate federal figure varies by year and methodology.
US population 65+ rose from 41M in 2011 to 63M in 2026
Consistent with Census Bureau historical and 2026 estimates.
47% of US healthcare spending related to obesity
Commonly cited figure from older studies; recent peer-reviewed estimates vary widely and are not uniformly accepted at that level.
Notable Concerns
- Rounded or approximate spending/fraud percentages presented without precise sourcing citations on floor