Tech Selloff Prompts Bubble Concerns Amid High Valuations
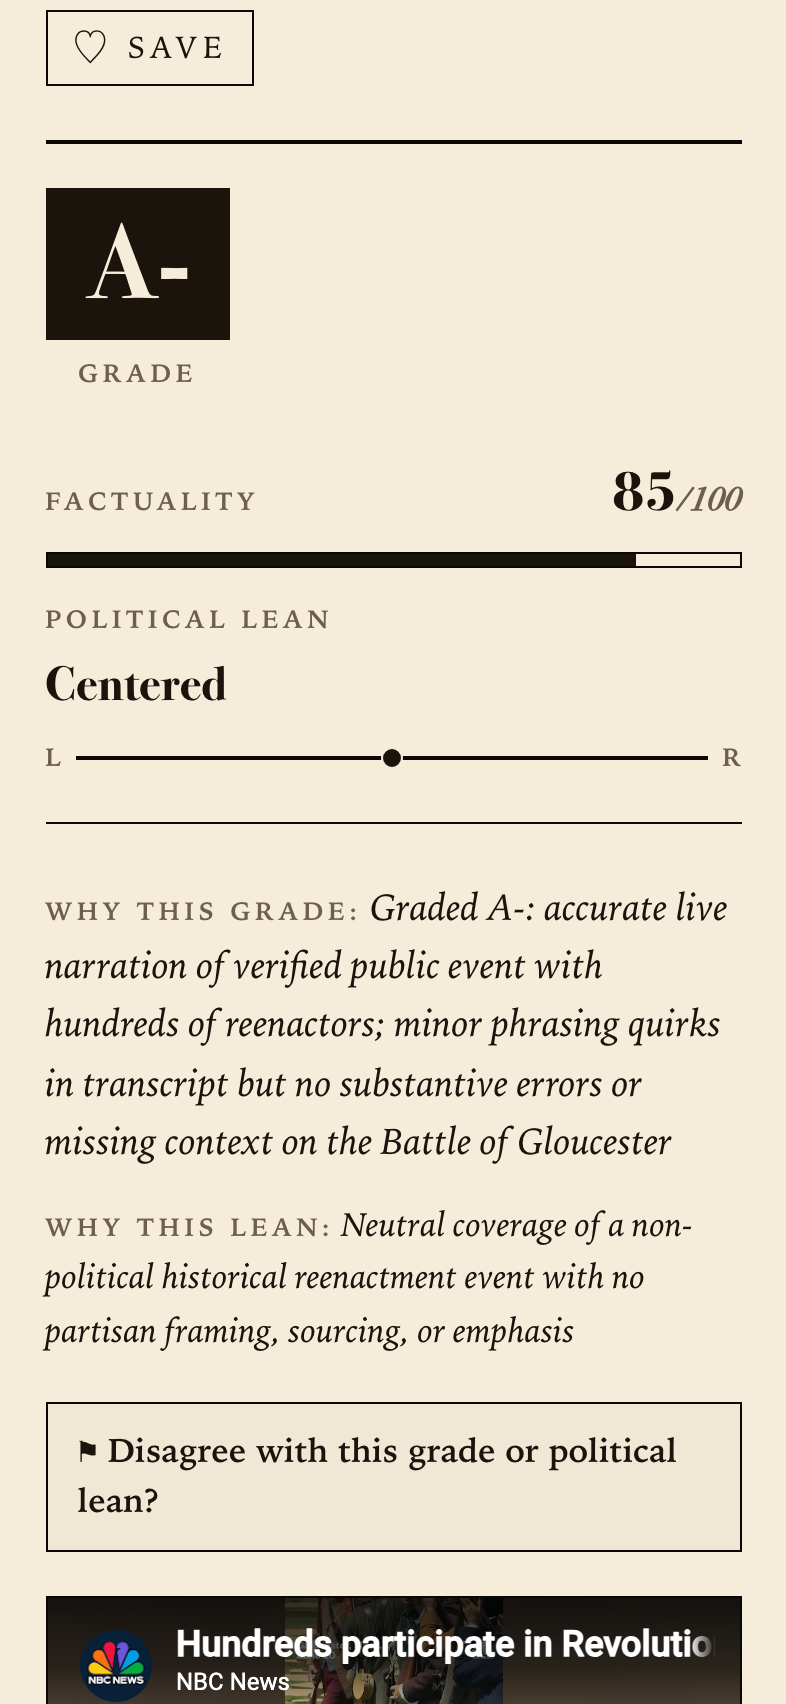
🔒 The letter grade, factuality score, and political-lean rating for this report are part of CladFacts Premium. The full report below is free to read.
Topics in This Edition
Summary
The Reuters segment examines recent tech stock weakness and resulting bubble fears in US markets. It highlights sharp gains in the semiconductor sector and elevated valuation metrics like the Buffett indicator while noting countervailing evidence from sentiment and positioning data. The report relies on standard market indicators and historical comparisons without naming specific guests or citing graphics. It contrasts 1999 dot-com parallels with current non-euphoric conditions to assess bubble risk.
Editorial Assessment
The claims hold up well against primary index data and valuation models, accurately reflecting YTD semiconductor performance near 100% and Buffett readings above 200%. Framing is measured, presenting red flags alongside reasons for caution about imminent reversal. Viewers may miss details on exact sentiment surveys or positioning metrics referenced, as well as broader economic context such as AI spending sustainability. No major factual errors or one-sided sourcing appear.
Key Moments
Semiconductor index up 100% this year, last seen in 1999 before dot-com burst
SOX YTD returns reported at 95-101% as of late June 2026; historical parallels noted in contemporaneous market commentary
Warren Buffett indicator north of 200%, signaling overvaluation
Current readings 219-232% as of Q1-Q2 2026 per multiple valuation trackers, well above historical norms
Sentiment and positioning not signaling bubble danger or euphoria
Transcript offers qualitative assessment without citing specific surveys or data sources for sentiment or positioning